How Drone Visuals Help Project Teams Spot Delays and Issues Early
Pinpointing Problems Before They Grow
Every project manager knows the feeling: you walk a site, see the work in progress, and hope nothing is slipping. But a single walk-through gives you only one angle, one moment in time, and a limited view of the whole area. Drones change that by capturing the site from above, regularly, in a way that lets you compare conditions across days and weeks. The specific visual data that helps teams catch delays and issues comes from time-series drone imagery - a sequence of orthomosaics or 3D models taken on the same flight path on different flight dates. By stacking these captures in a data platform, you can see exactly where work has stalled, where materials are piling up, and where the ground has shifted.
The direct answer is that the most useful drone visuals for spotting delays are time-stamped orthomosaics and elevation models that you can overlay, toggle, or animate. When you line up two captures of the same area, differences jump out: a foundation that hasn't been poured, a stockpile that hasn't moved, a trench that hasn't been backfilled. The routine of flying the same route on each flight date turns a set of separate images into a timeline you can scrub through. That timeline, built from repeated site captures, is the core of progress monitoring.
Why a Single Snapshot Is Not Enough
A single drone photo can show you the state of a site on a given morning. It is useful for a quick check, but it does not tell you whether the pace of work is ahead or behind. A delay only becomes visible when you have a reference - last week's photo, last month's orthomosaic. Without that comparison, a half-built wall or a missing pipe run might look normal. With time-series drone imagery, you can open two captures side by side or overlay them with a slider. The eye picks up changes instantly: new structures, removed vegetation, moved equipment. That is the difference between a simple photo and a monitoring tool.
Project teams that rely on weekly site captures often find that the real value is in comparing construction sites over time. That phrase describes the core workflow: you take a capture on a regular cadence, process it into a georeferenced orthomosaic, and repeat. After a few cycles, you have a stack of layers. Open them in a viewer that supports change detection, and the software highlights areas where the surface has changed. A delayed excavation shows as a persistent hole where the ground elevation has not changed. A missing concrete pour shows as a region where the surface texture has not changed. These signals are easy to miss on a single photo but obvious when you flip between dates.
What to Look For in the Visuals
Not all drone deliverables are equally useful for spotting delays. Here are the types that give the clearest signals:
- Orthomosaics - these are stitched, georeferenced images that cover the whole site. When you align two orthomosaics from different flight dates, you can measure distances and areas. A stockpile that has not shrunk tells you material is not being used. A foundation that has not grown tells you work has paused.
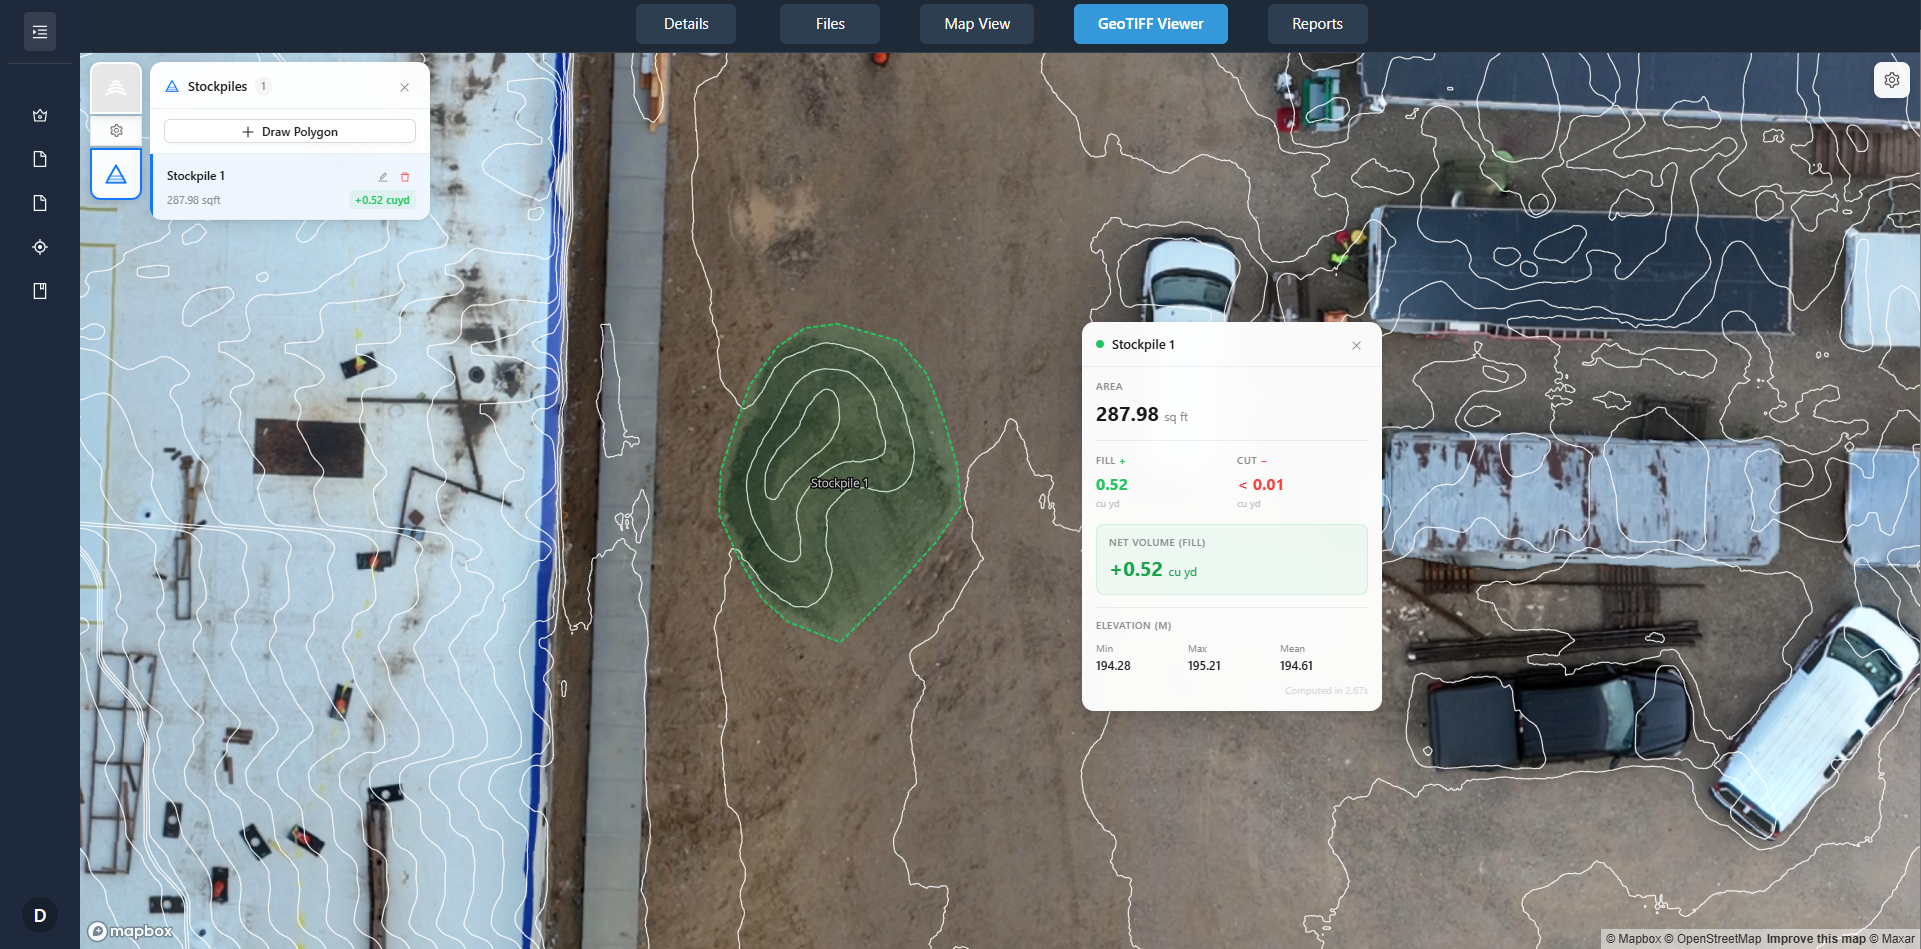
- Digital surface models (DSMs) - these show elevation. Comparing DSMs reveals cut and fill volumes. If the earthwork volume has not changed between two captures, grading has stopped. That is a delay in site prep.
- Point clouds and 3D meshes - these give detailed shape data. You can rotate and zoom to inspect a specific beam or column. If a steel frame looks the same two weeks later, fabrication or erection has stalled.
- Thermal or multispectral layers - less common for progress, but useful for spotting moisture or heat anomalies that indicate leaks or equipment issues before they cause schedule slips.
Each type of visual is most powerful when you have a baseline. The first flight is your reference. Every flight after that is a check against the reference. The platform that stores these layers should let you toggle between dates, overlay change detection heat maps, and add site annotations that flag issues for the team.
How to Read the Timeline
Interpreting time-series drone imagery takes a little practice, but the principles are straightforward. Start by opening the most recent orthomosaic and the one from two weeks ago. Look for areas that look identical. If a zone that should be active looks frozen, that is a candidate for a delay. Then open the elevation models. If the ground surface has not changed where excavation was planned, the schedule is off. Mark that area with a site annotation - a pin or a polygon - and assign it to the superintendent. The annotation becomes part of the project timeline, linking the visual evidence to the action item.
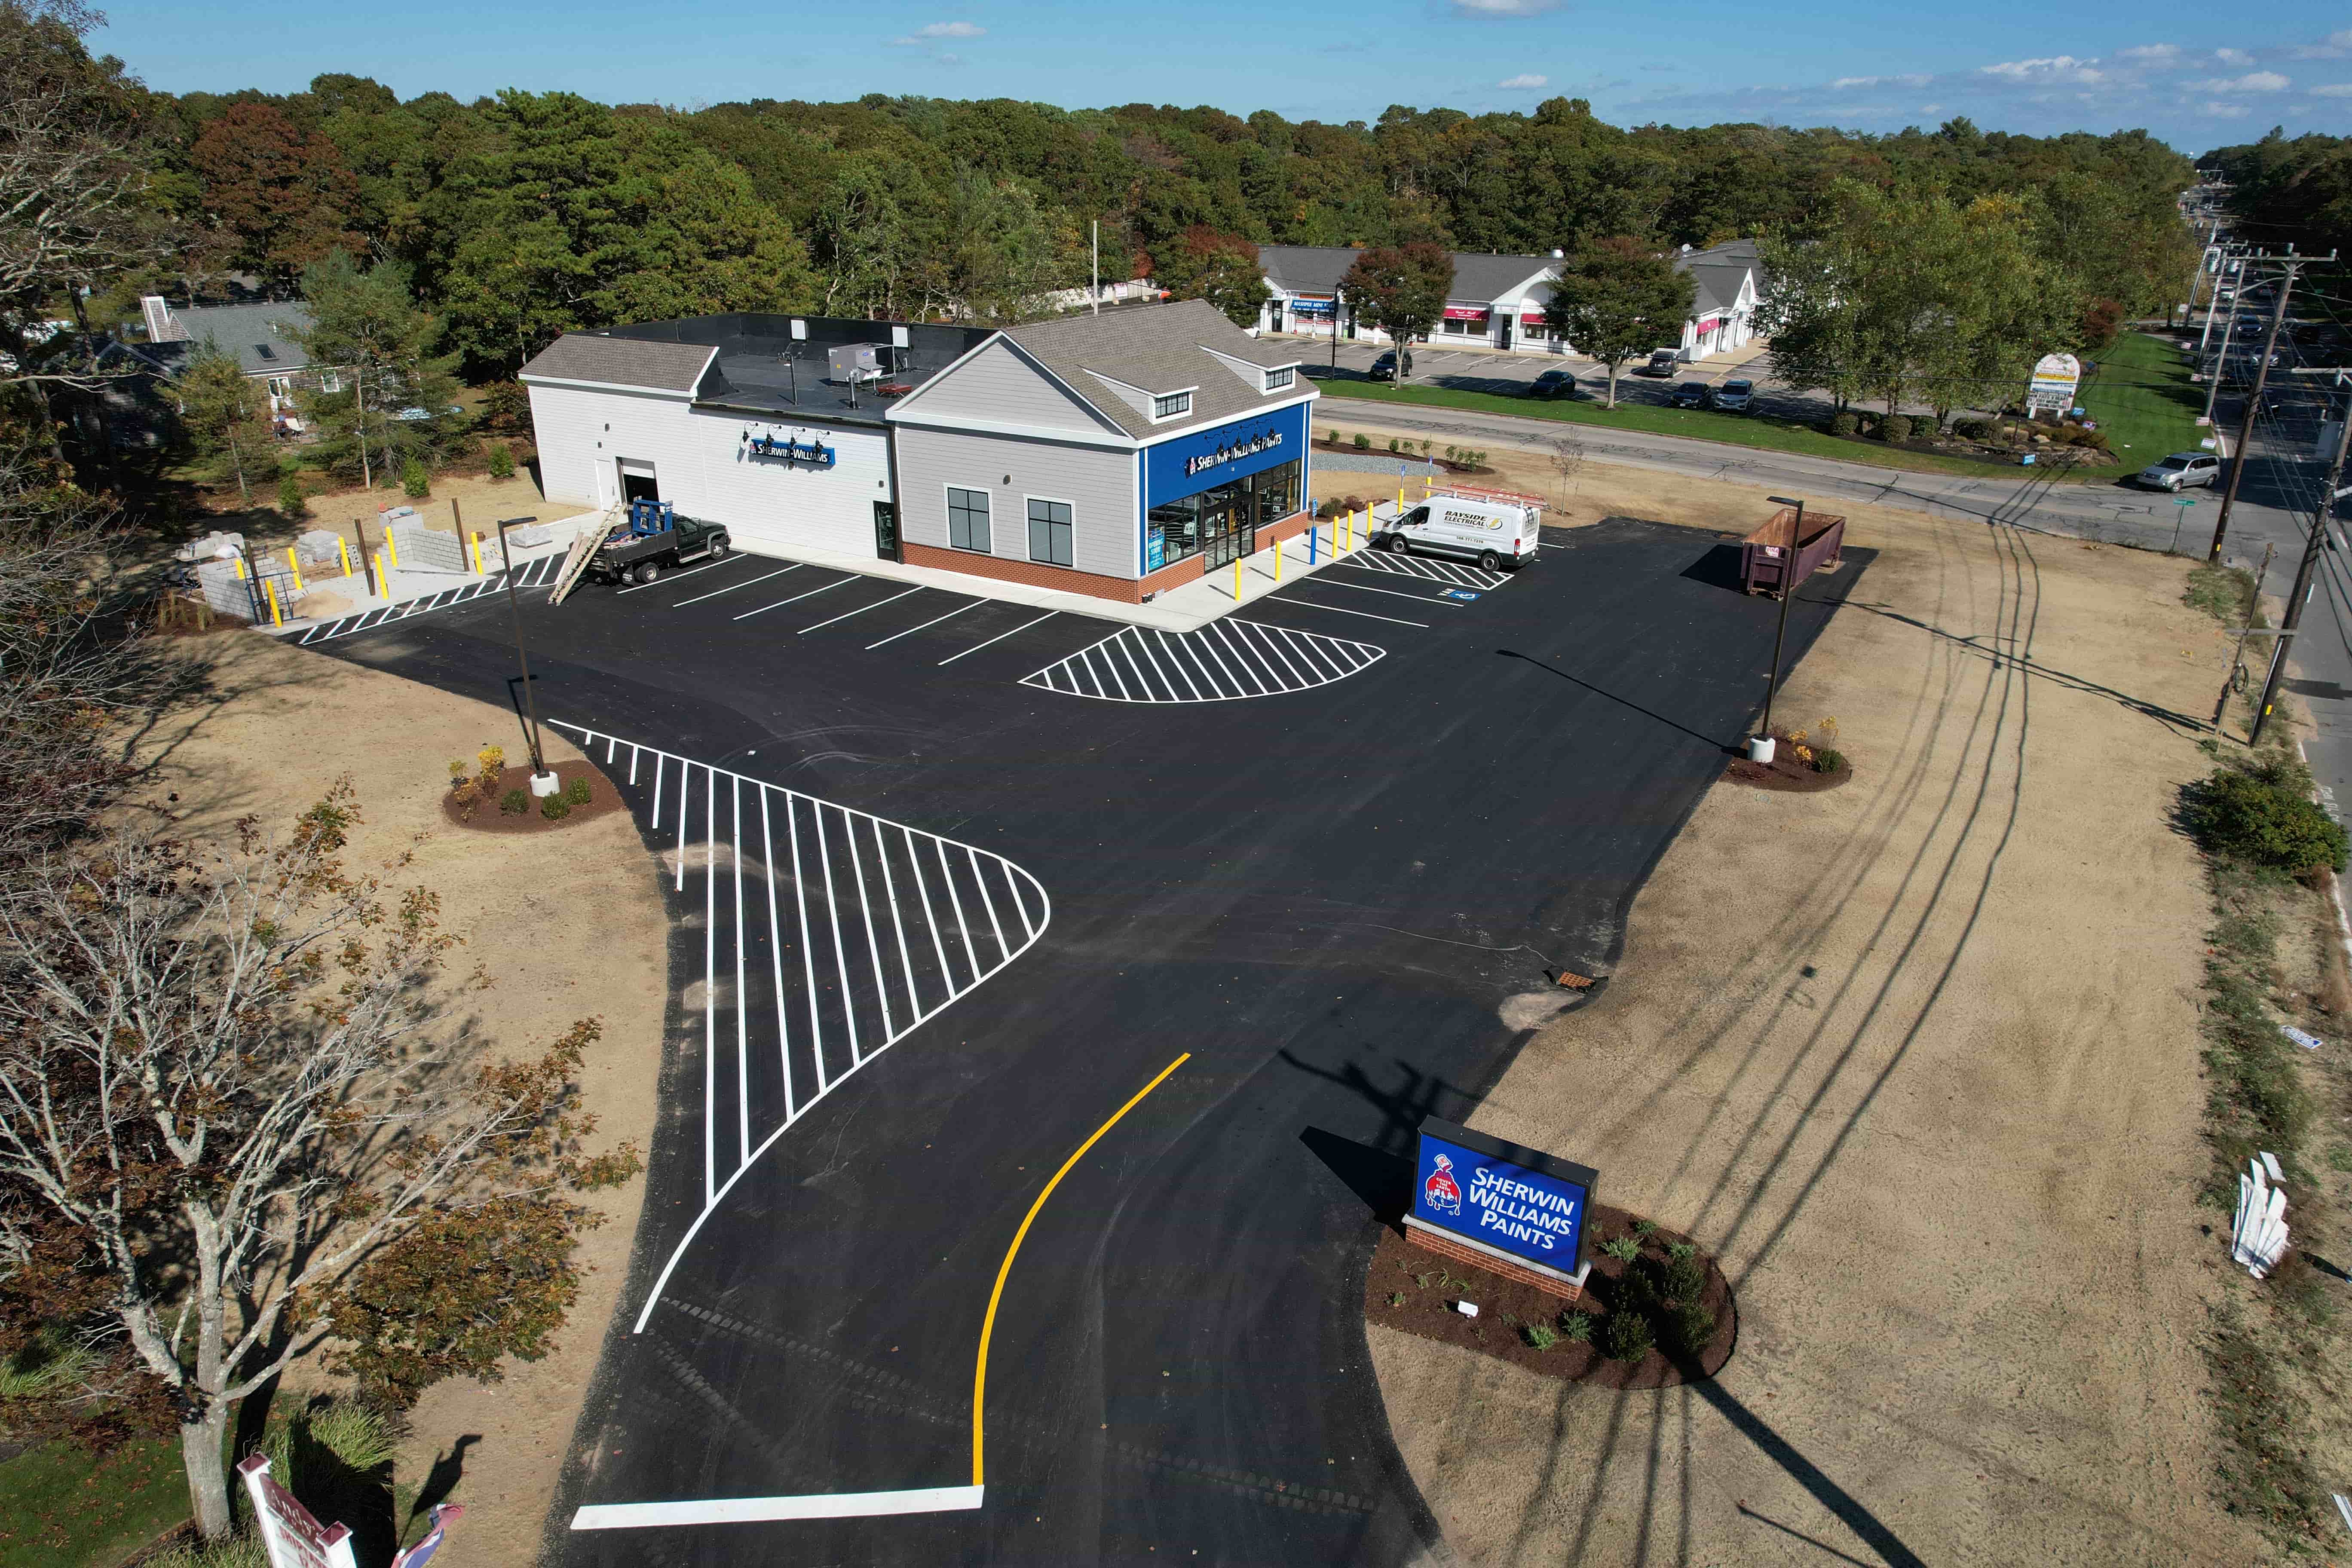
Many teams set up a routine: fly every week, process the data within 24 hours, and hold a short review meeting with the orthomosaics side by side. The meeting is not about the photos; it is about the differences. The person who walked the site can confirm whether a visible gap is a real delay or just a staging decision. The drone data gives everyone the same ground truth, removing arguments about who saw what. That clarity speeds up decisions and keeps the project moving.
One common pattern is that a delay shows up first in the elevation data before it appears in the orthomosaic. For example, a foundation excavation that is only half done might look similar in a top-down photo, but the DSM will show that the hole is shallower than planned. That early signal lets the team order more excavation or adjust the concrete schedule before the delay becomes critical. Another pattern is that material stockpiles grow when work slows. A pile that keeps getting bigger while the building footprint stays the same is a visual clue that material is being delivered but not installed. That is a delay in the making.
Making It a Habit
The real power of this approach is not in any single image; it is in the habit of comparing construction sites over time. When you have a consistent capture schedule and a platform that stacks the data, you build a visual record that every stakeholder can use. The owner can see progress from a distance. The general contractor can verify subcontractor claims. The project manager can point to a specific area and say, "That section has not changed in three weeks - what is the plan?" The conversation shifts from opinion to evidence.
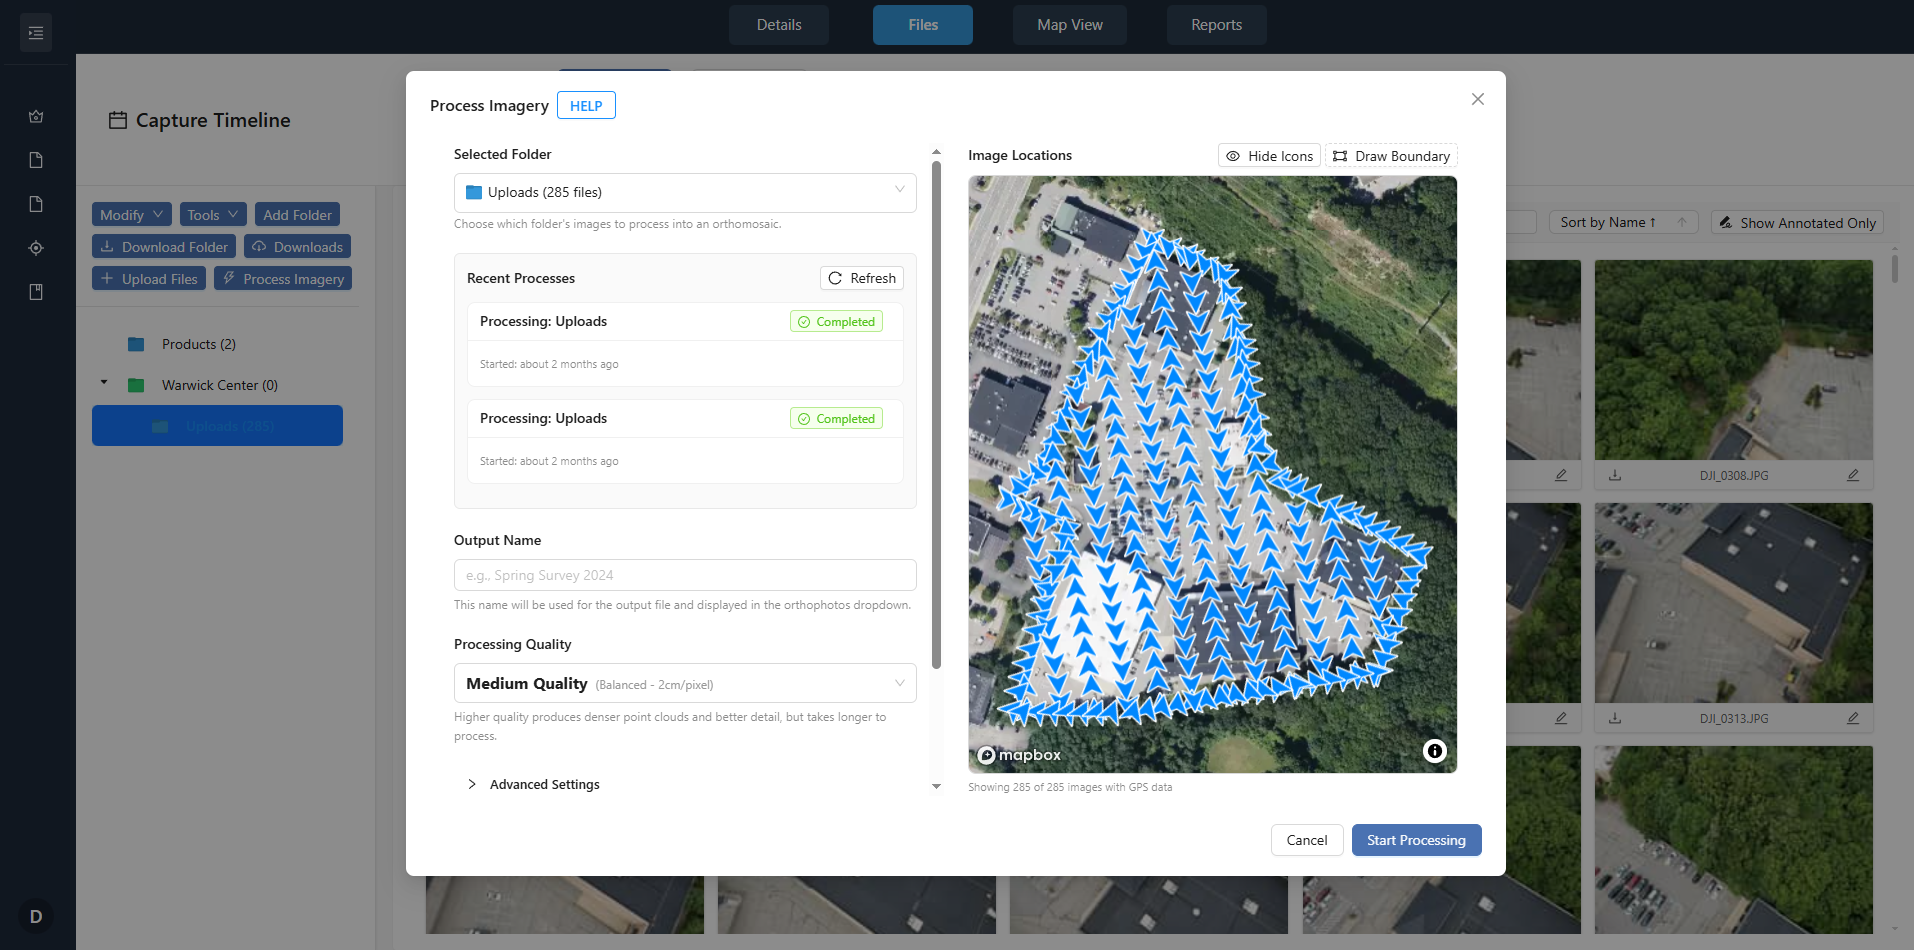
To get the most out of time-series drone imagery, keep your flight path consistent. Mark the flight boundaries on a map so the pilot flies the same area each time. Process the images to the same resolution and coordinate system. Store them in a portal that lets you overlay dates and add site annotations. With that setup, a quick visual check becomes a reliable early warning system for delays, rework, and material issues. The drone does not replace the superintendent - it gives them a better view.
In practice, teams that adopt this workflow often find that they catch issues a week or two earlier than they would from ground inspections alone. That early notice can be the difference between a minor schedule adjustment and a major delay that pushes the completion date. The visuals do not make decisions; they surface the information that supports good decisions. And that is exactly what a project team needs to stay on track.